- info@protogramma.gr
- Mon - Fri: 9:00 - 17:00
Power BI
// DESCRIPTION
Discover the Power of Business Analytics with Power BI
Design and implement your solutions
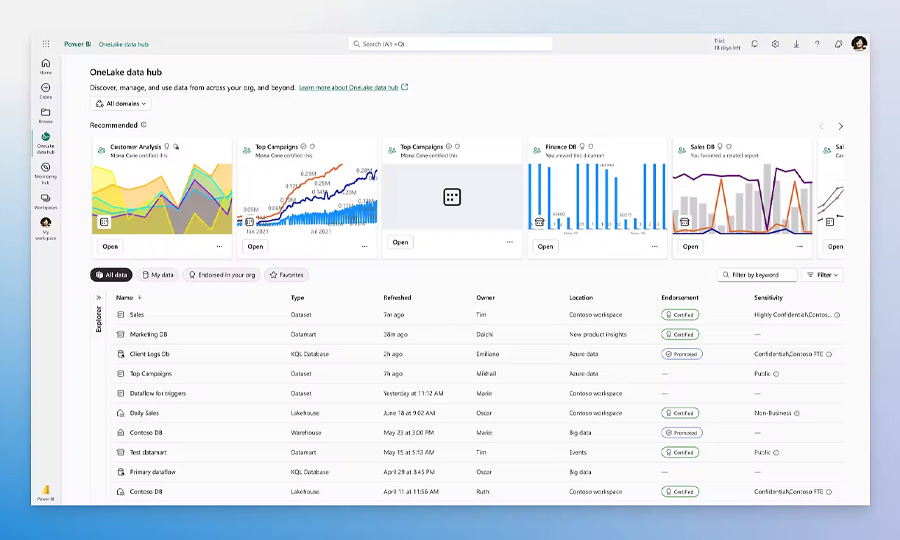
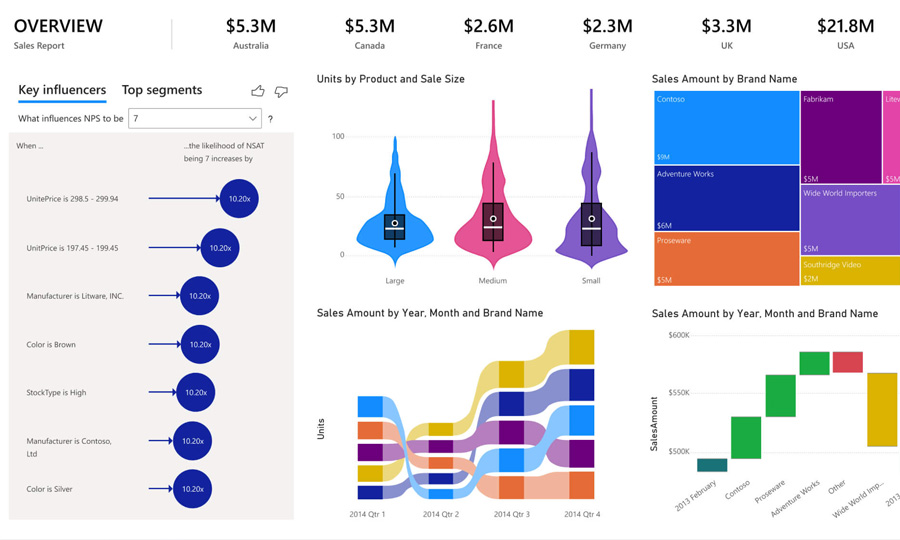
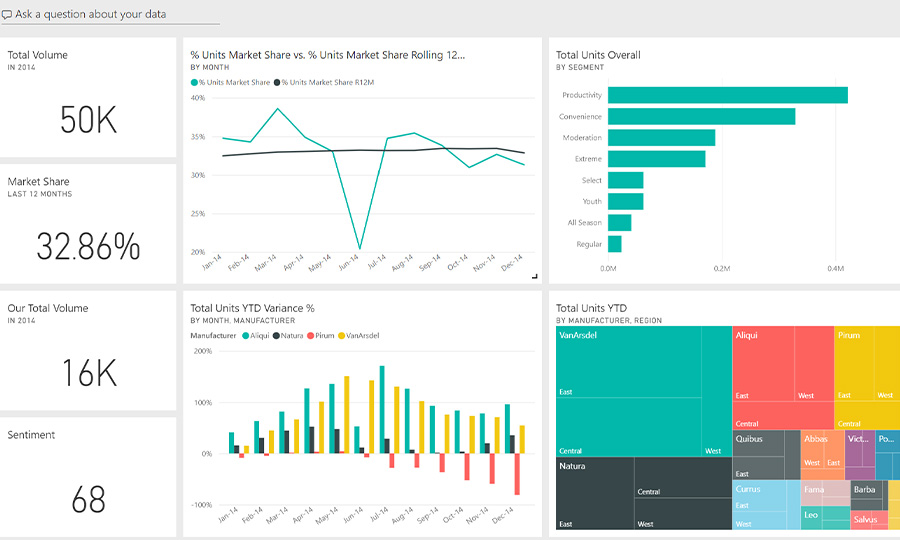
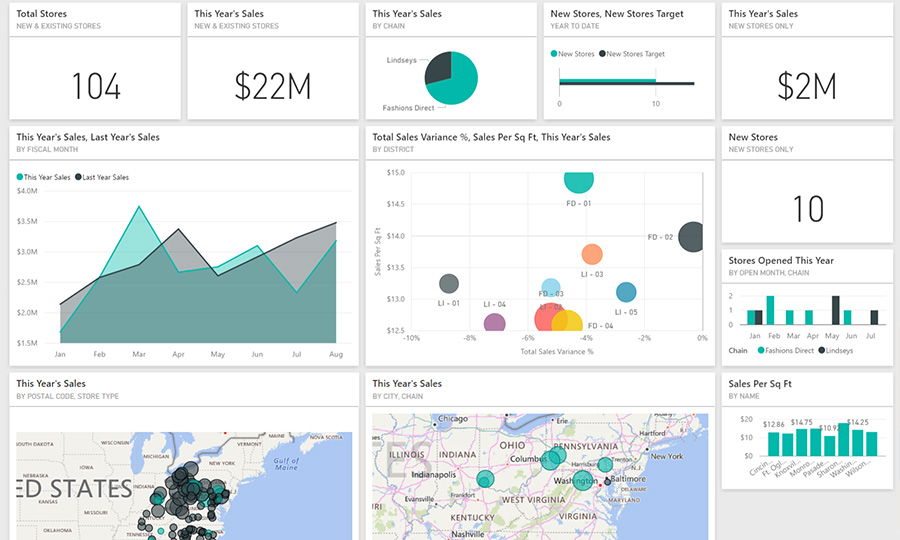
Microsoft Power BI is the leading business analytics platform that lets you turn your data into actionable insights. Using interactive dashboards, advanced analytics, and data automation, Power BI helps you make informed decisions based on real data.
Unleash the power of data analytics to identify growth opportunities, improve your business performance, and gain a competitive advantage.

// WHAT IS IT?
Turn Your Data into Actions
Power BI is a comprehensive business analytics tool that allows you to:
- Connect data from multiple sources, including ERP systems, Microsoft Excel, SQL Server, Google Analytics, and more.
- Create interactive dashboards and reports that are easy for everyone to understand. Share insights with your team in real time.
- Make data-driven decisions using advanced analytics tools. With Power BI, data analysis becomes easier, faster, and more efficient.
// ADVANTAGES
Why Choose Power BI for Your Business
Microsoft Power BI offers unique advantages that make it an essential tool for every business.
With Power BI, data analysis becomes more secure, flexible, and efficient.
Interactive Visualizations
Transform your data into impressive charts, maps, and dashboards that are easy for everyone to understand.
Easy Data Interconnection
Connect data from over 275 sources, including Microsoft Excel, SQL Server, Google Analytics, Dynamics 365, and many more.
Access from Anywhere
View your dashboards from any device, either via the web or the Power BI mobile app.
Data Security
Ensure your data is protected with Microsoft's built-in security tools.
Integration with Microsoft 365
Combine Power BI with tools like Excel, Teams, and SharePoint for a complete experience.
// USE
See what Power BI can do for you
Power BI is ideal for any business that wants to leverage its data. Some of the key uses include:
-
Sales Analytics: Track your sales in real time and identify growth opportunities.
-
Performance Tracking: Create KPIs (Key Performance Indicators) to measure your business performance.
-
Customer Analytics: Understand your customers’ needs and improve their experience.
-
Inventory Management: Track your inventory and optimize its management.
-
Financial Data Analytics: Identify trends and improve your strategy.
With Power BI, you can turn your data into real business value.
// EXAMPLES
See Power BI in Action
Power BI can be used in many areas for data analysis and visualization. Examples include:
- Sales Dashboard: Track your sales by product, region, or customer.
- Website Traffic Analysis: Identify traffic sources and improve your online strategy.
- Financial Data Monitoring: Analyze revenue, expenses, and profitability in real time.
- Supply Chain Analysis: Optimize your inventory management and supply chain.
With Power BI, you can create custom dashboards that meet your business needs.


// CONTACT
Ask for information
See the benefits of Power BI
Contact us to show you the benefits of using Power Platform